General Information
The following page provides an overview of common actions and functions within the reports application. It covers the general layout of the reporting interface, the steps for opening a report, the toolbar icons and their functions, and the left hand Dimensions Bar, where filters and adjustments to reports can be applied.
General Information Topics
Layout
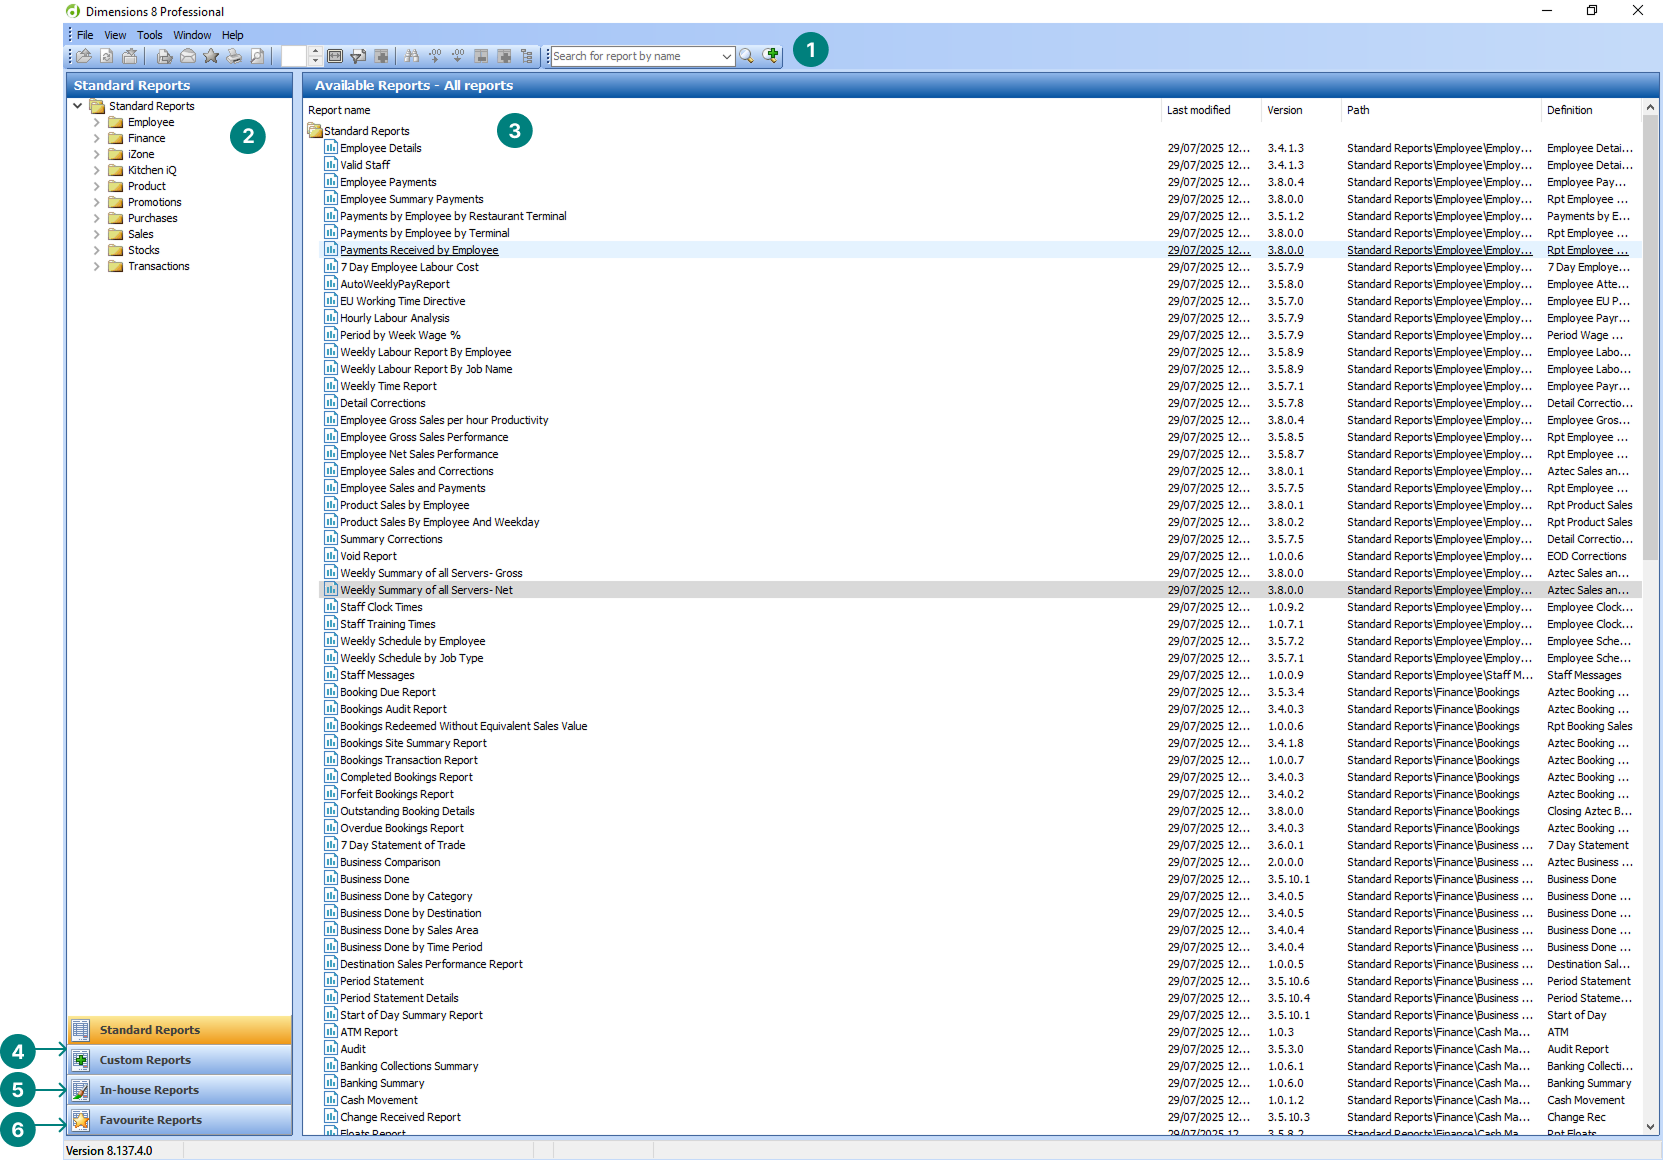
Reports has the 6 primary sections (when launching the application):
-
Icon Toolbar (becomes active when a report is opened)
-
Standard Report Folders
-
Report List (updates based on the selections made in the folders)
-
Custom Reports (bespoke reports written for customers by Zonal)
-
In-House Reports (reports written with report designer)
-
Favourites (reports that have been saved to the favourites section)
Opening Reports
Follow these steps to open a report:
-
Choose one of the following options to locate the report
-
From the Available Reports select a report
-
Enter a term in the Search
-
Navigate the Report Tree
-
-
Click the Report to open | the Report Details options will be displayed
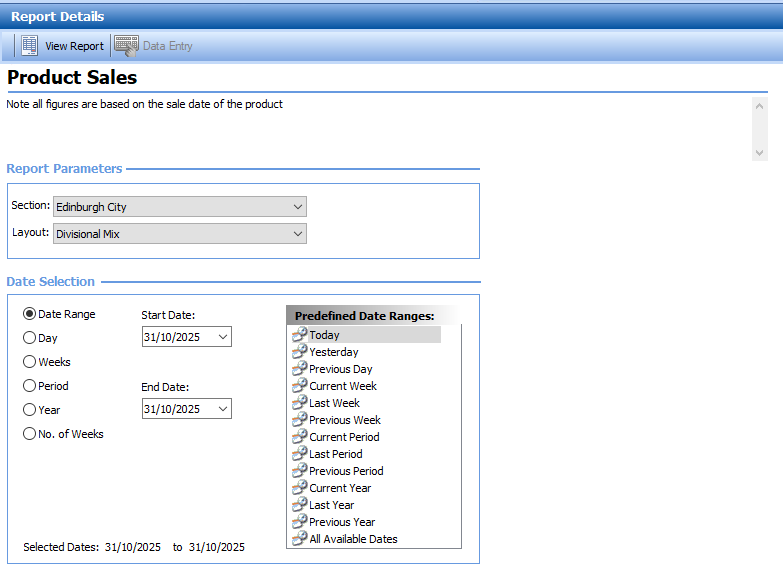
Depending on the type of report the options shown or that can be selected will vary
Click here for more information on options that can be selected when opening reportsThe following table outlines each setting and its corresponding functionality.
Option / Selection Description Additional Information Report Parameters Section The section typically on most reports refers to the site but in some reports it could be the estate structure area
For Site Master and Site installations there will only be one site shown
Layout The layout refers to the tabs that can be shown when a report is opened, layouts vary by report
Selecting an alternative layout from the list will display when the report is opened Date Selection Depending on the report not all date options will be visible, some reports are designed to be per day / week only
Date Range Enables a range of dates to be set
Day Enables a selected date to be set
Weeks Enables a week ending to be set
Period Enables a period number to be set
No. Of Weeks Enables a number of weeks to be set
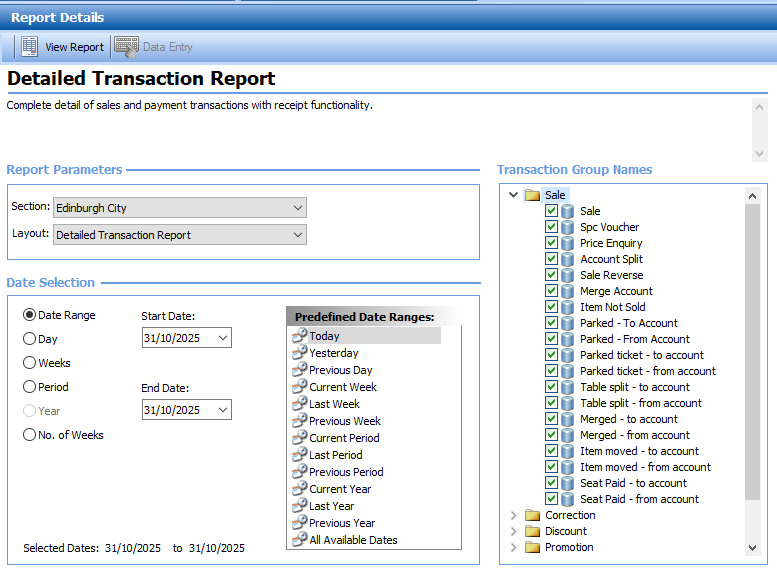
A check box option enables the current week to be excluded Predefined Date Ranges The predefined date ranges enable a quick selection of options from the list displayed Product Drill Product Structure and Product The product drill enables a selection of one product, navigate the product structure until the products are displayed and make a selection to be included in the report An example of the product drill can be found in the Basket Analysis Report Recipe Subgroup Product Structure and Subcategory The recipe subgroup enables a selection of one or more subcategories to be included in the report An example of the recipe subgroup can be found in the Recipe Make-up Report Stock Sales Profitability Dimension Thread Structure and Accepted Stocks The stock sales profitability dimension enables an accepted stock to selected for reporting Transaction Group Names Groups and Options The transactions group names allow a selection of different options within a group to be selected, each group has multiple options
The groups are:
-
Sale
-
Correction
-
Discount
-
Promotion
-
Payment
-
No Sale
-
Contributions
An example of the transaction groups name option can be found in the Detailed Transaction Report -
-
Click View Report
Toolbar
The toolbar contains a number of actions that can be used when a report is open.
The following table outlines each setting and its corresponding functionality.
![]()
| Icon | Function | Description |
|---|---|---|
| 1 |
New (open another report) |
This function enables another report to be opened whilst still keeping the current report open |
| 2 |
Refresh |
This function enables the current report to be refreshed and will update with any new data |
| 3 |
Close Report |
This function will close the current report |
| 4 |
Export Report |
This function will export the current report to the follow formats
|
| 5 |
Send Report via Email |
This function will attach the report in the selected format to a new email (email client has to be installed on the same machine as reports) |
| 6 |
Add to Favourites |
This function allows the current report to be saved as a favourite |
| 7 |
|
This function prints the current report |
| 8 |
Print Preview |
This function enables a print preview of the current report |
| 9 | Percentage Indicator |
This function enables a custom percentage zoom in / out to be set |
| 10 | Zoom Menu |
This function enables to zoom in / out or choose a predefined zoom percentage |
| 11 | Remove Layout Filter |
This function enables a filter that has been applied to be removed |
| 12 | Show Hidden Views |
This function enables views currently hidden to be displayed |
| 13 | Lookup Filter |
This function enables additional filters to be applied to the current report allowing multiple items to be filtered |
| 14 | Suppress Zero Rows |
This function enables rows with zero values to be removed from the report |
| 15 | Suppress Zero Columns |
This function enables columns with zero values to be removed from the report |
| 16 | Hide Columns |
This function enables selected columns within a report to be hidden / turned off for the report |
| 17 | Show All Columns |
This function re-enables all previously hidden columns |
| 18 | Show / Hide Dimensions Bar |
This function hides / shows the dimensions bar (the section that appears on the left when a report is opened) |
Dimensions Bar
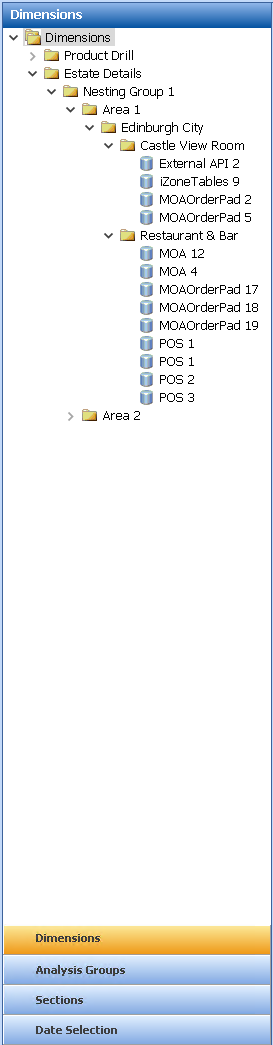
The Dimensions bar appears on the left side of the report and may include a range of filters and options, depending on the specific report being viewed.
The Dimensions Bar includes several common options that allow you to adjust the report details from the initial selection without needing to close and reopen the report.
-
Dimensions - product or estate structure
-
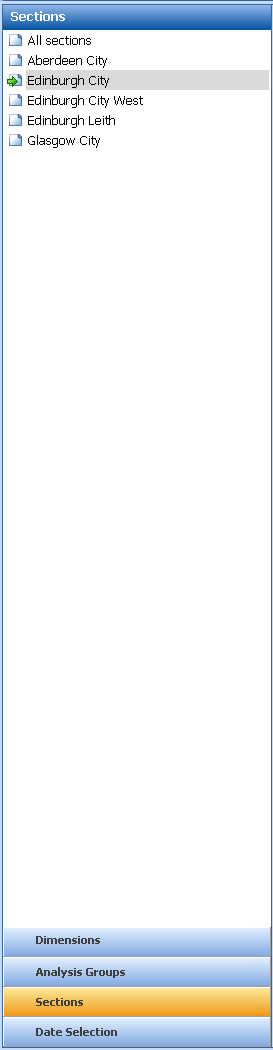
Section - site selection
-
Date - date selection
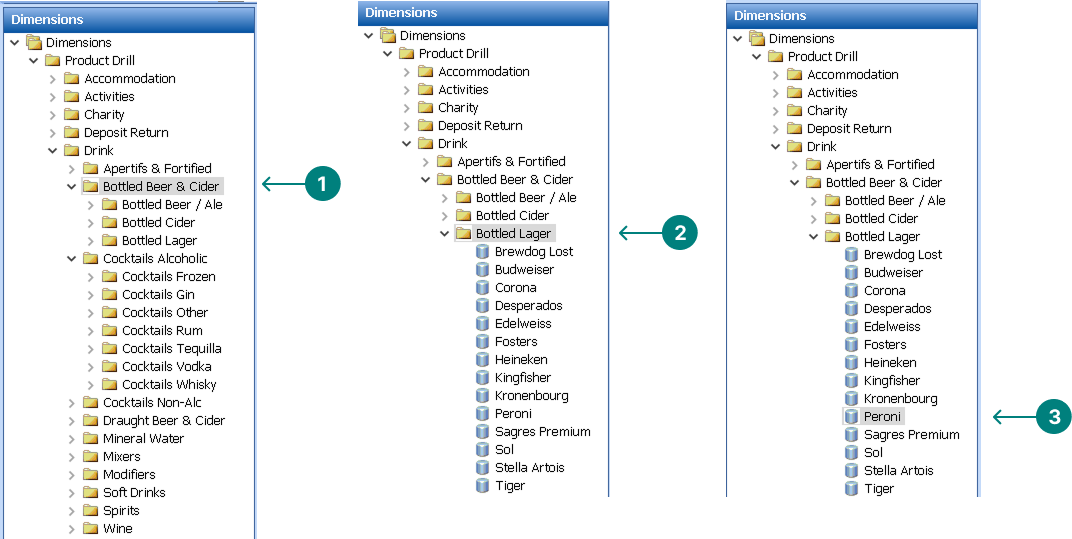
Applying Product Dimensions
-
Each level of the Product Drill will enable a selection to be made
-
Each level can be expanded and selected until the bottom level (product) is displayed where a product level dimension can be selected
-
Product Drill and Estate Detail dimensions can be combined to provide granular reporting detail
-
Category Level Selection
-
Subcategory Level Selection
-
Product Level Selection
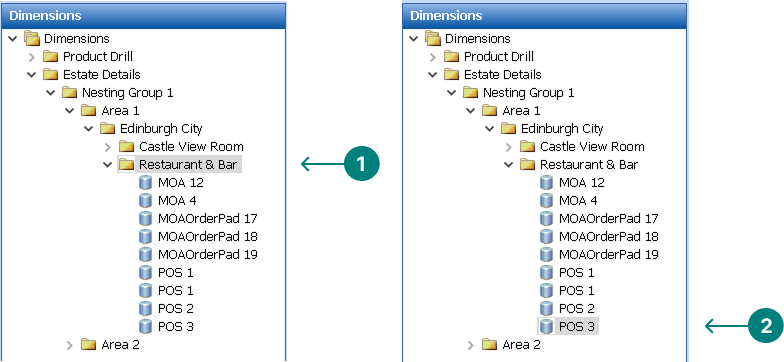
Applying Estate Details Dimensions
-
Each level of the Estate Details will enable a selection to be made
-
Each level can be expanded and selected until the bottom level (point of sale) is displayed where a POS dimension can be selected
-
Estate level and Product Drill dimensions can be combined to provide granular reporting detail
-
Sales Area Selection
-
Point of Sale Selection
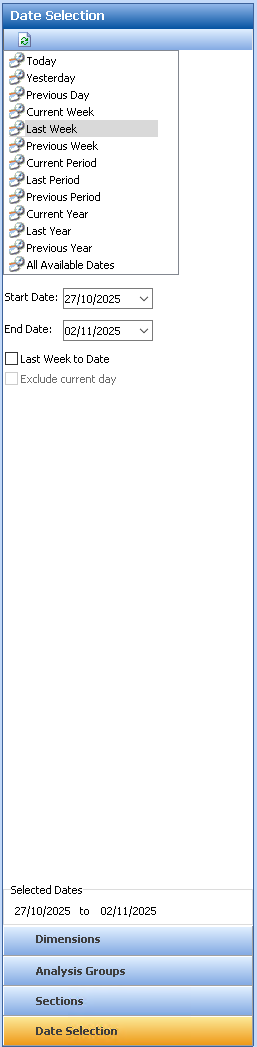
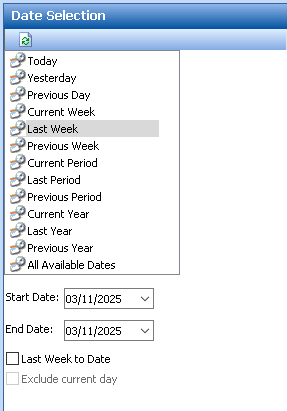
Date Dimensions
-
The Date Selection dimension will enable a change to be made to original date when opening the report
-
Select a new date option to display the report
Measures
Some reports include an additional Dimension called 'Measures', which allows you to switch the report’s data between different value types. As there are many possible measures, a good example of how this can be used is to compare the same report by quantity versus value.
Follow these steps to change the measure:
-
Select Measures
-
Click an alternative measure to apply to the report
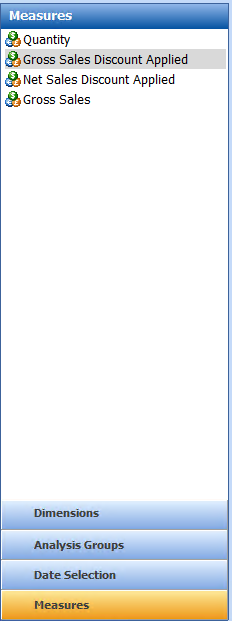
Typical Measures an include:
-
Gross
-
Net
-
Quantity
-
With / Without Discount
-
Amount Discounted
-
Analysis Groups
Analysis groups enable a selection of multiple Dimensions to be applied into a group and applied to a report.
Follow these steps to add an analysis group:
-
Select Analysis Groups
-
From the white space area Right Click | select New
-
Enter the Analysis Group Name
-
Make selections from the available Dimensions shown on the left and click the Right Arrow icon to move the selection into the Filters
A selected filter can be removed by selecting and clicking the Left Arrow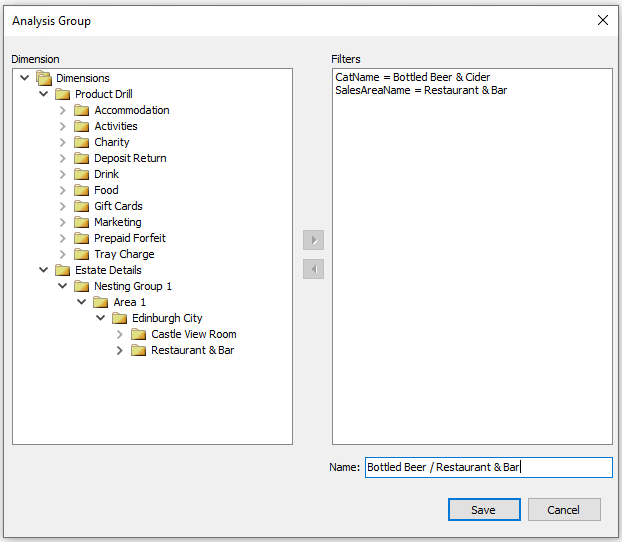
-
Click Save
The created groups will be displayed in the Analysis Groups
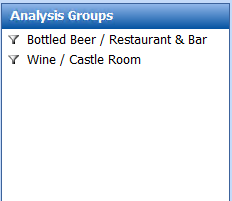
-
Click a Group to apply a filter which will refresh the report and display results based on the filters selected in the group
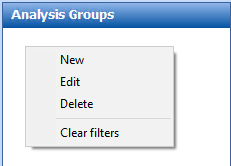
Other Actions
-
Clear Filters - from the white space area Right Click | select Clear Filters | click Yes to refresh the report
-
Edit Filters - Right Click on an Analysis Groups | select Edit | update the filters | click Save