Graphs
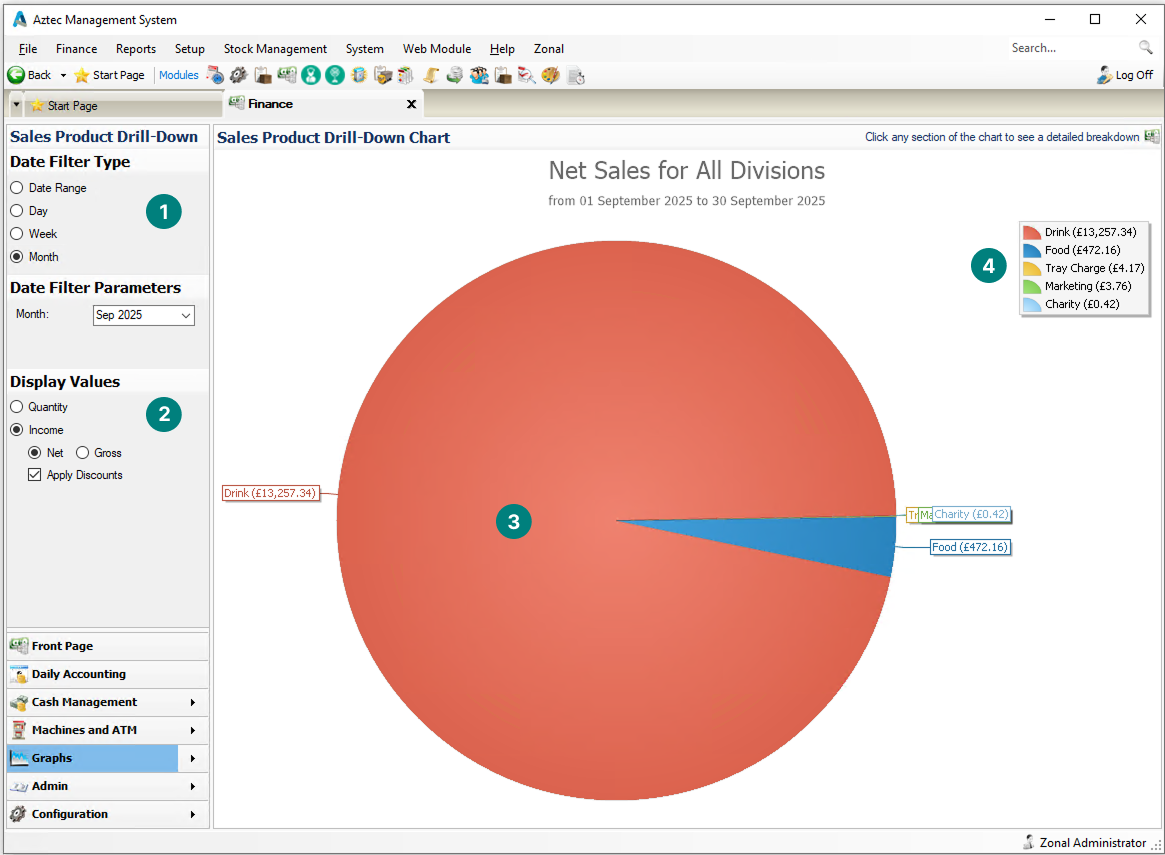
The graphs section provides a simple pie chart which provides an over view of sales from division to product level using the chart drill down option.
Topics
Navigate to Finance → Graphs
Graph Options
Graphs has 4 primary sections:
-
Date Filter Types
-
Display Values
-
Chart with Drill down
-
Double click a section of the chart to drill down to view more
-
-
Key to Chart